📈 Observability & Monitoring Solutions
Real-time visibility into your infrastructure, applications, and business systems.
Swipe to see more
Systems fail. Networks stall. Applications misbehave. The question isn’t if something will go wrong, but how quickly you’ll notice—and how fast you can respond. That’s why observability matters.
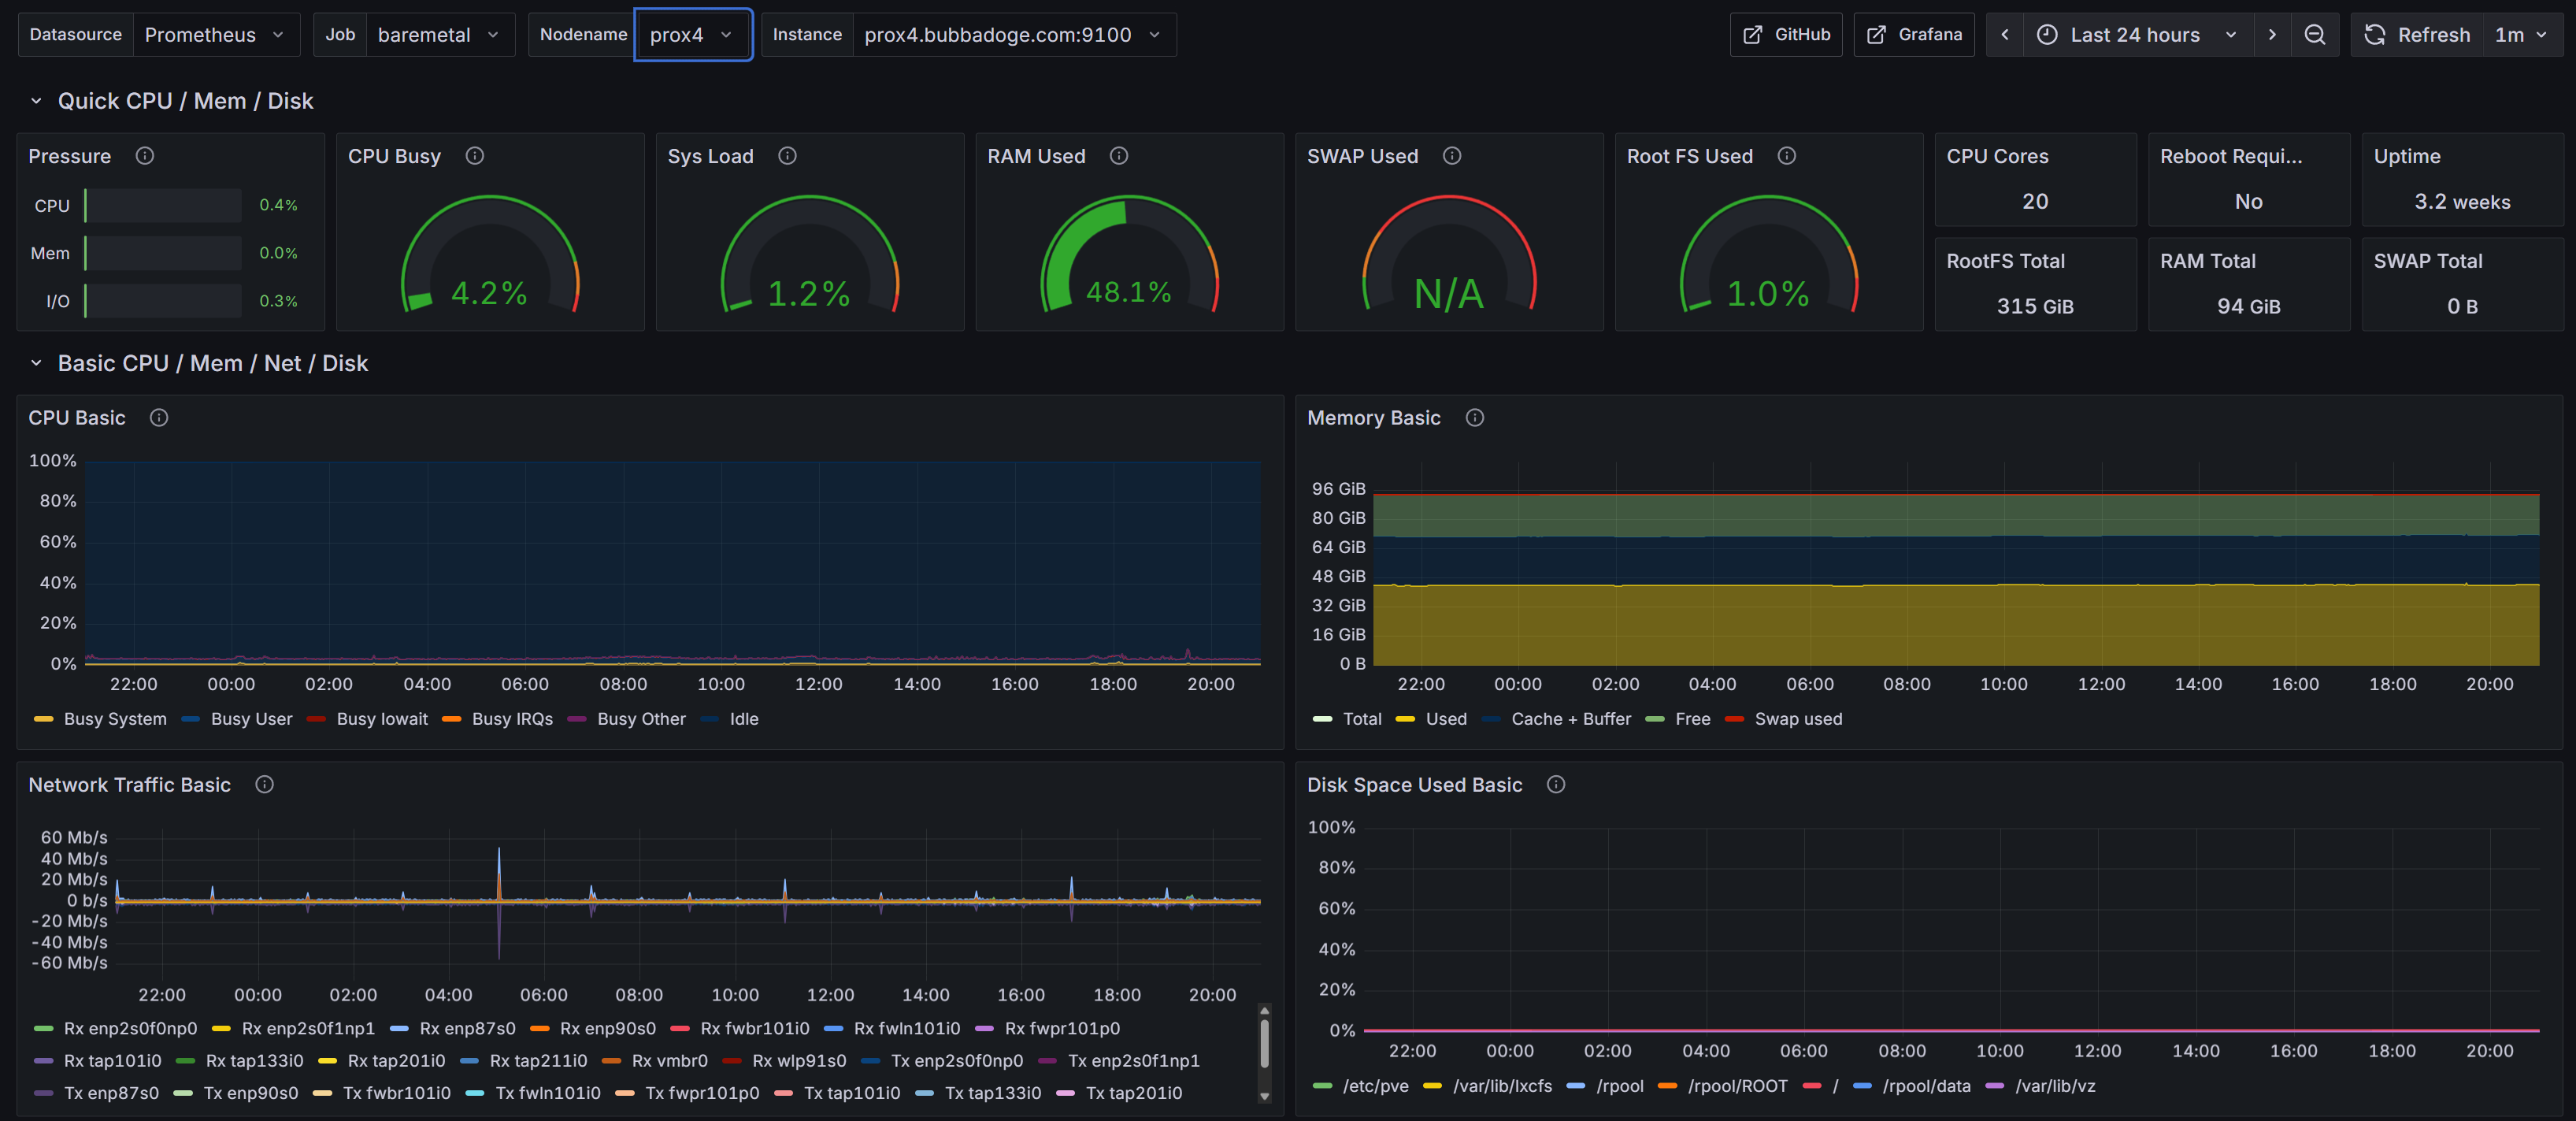
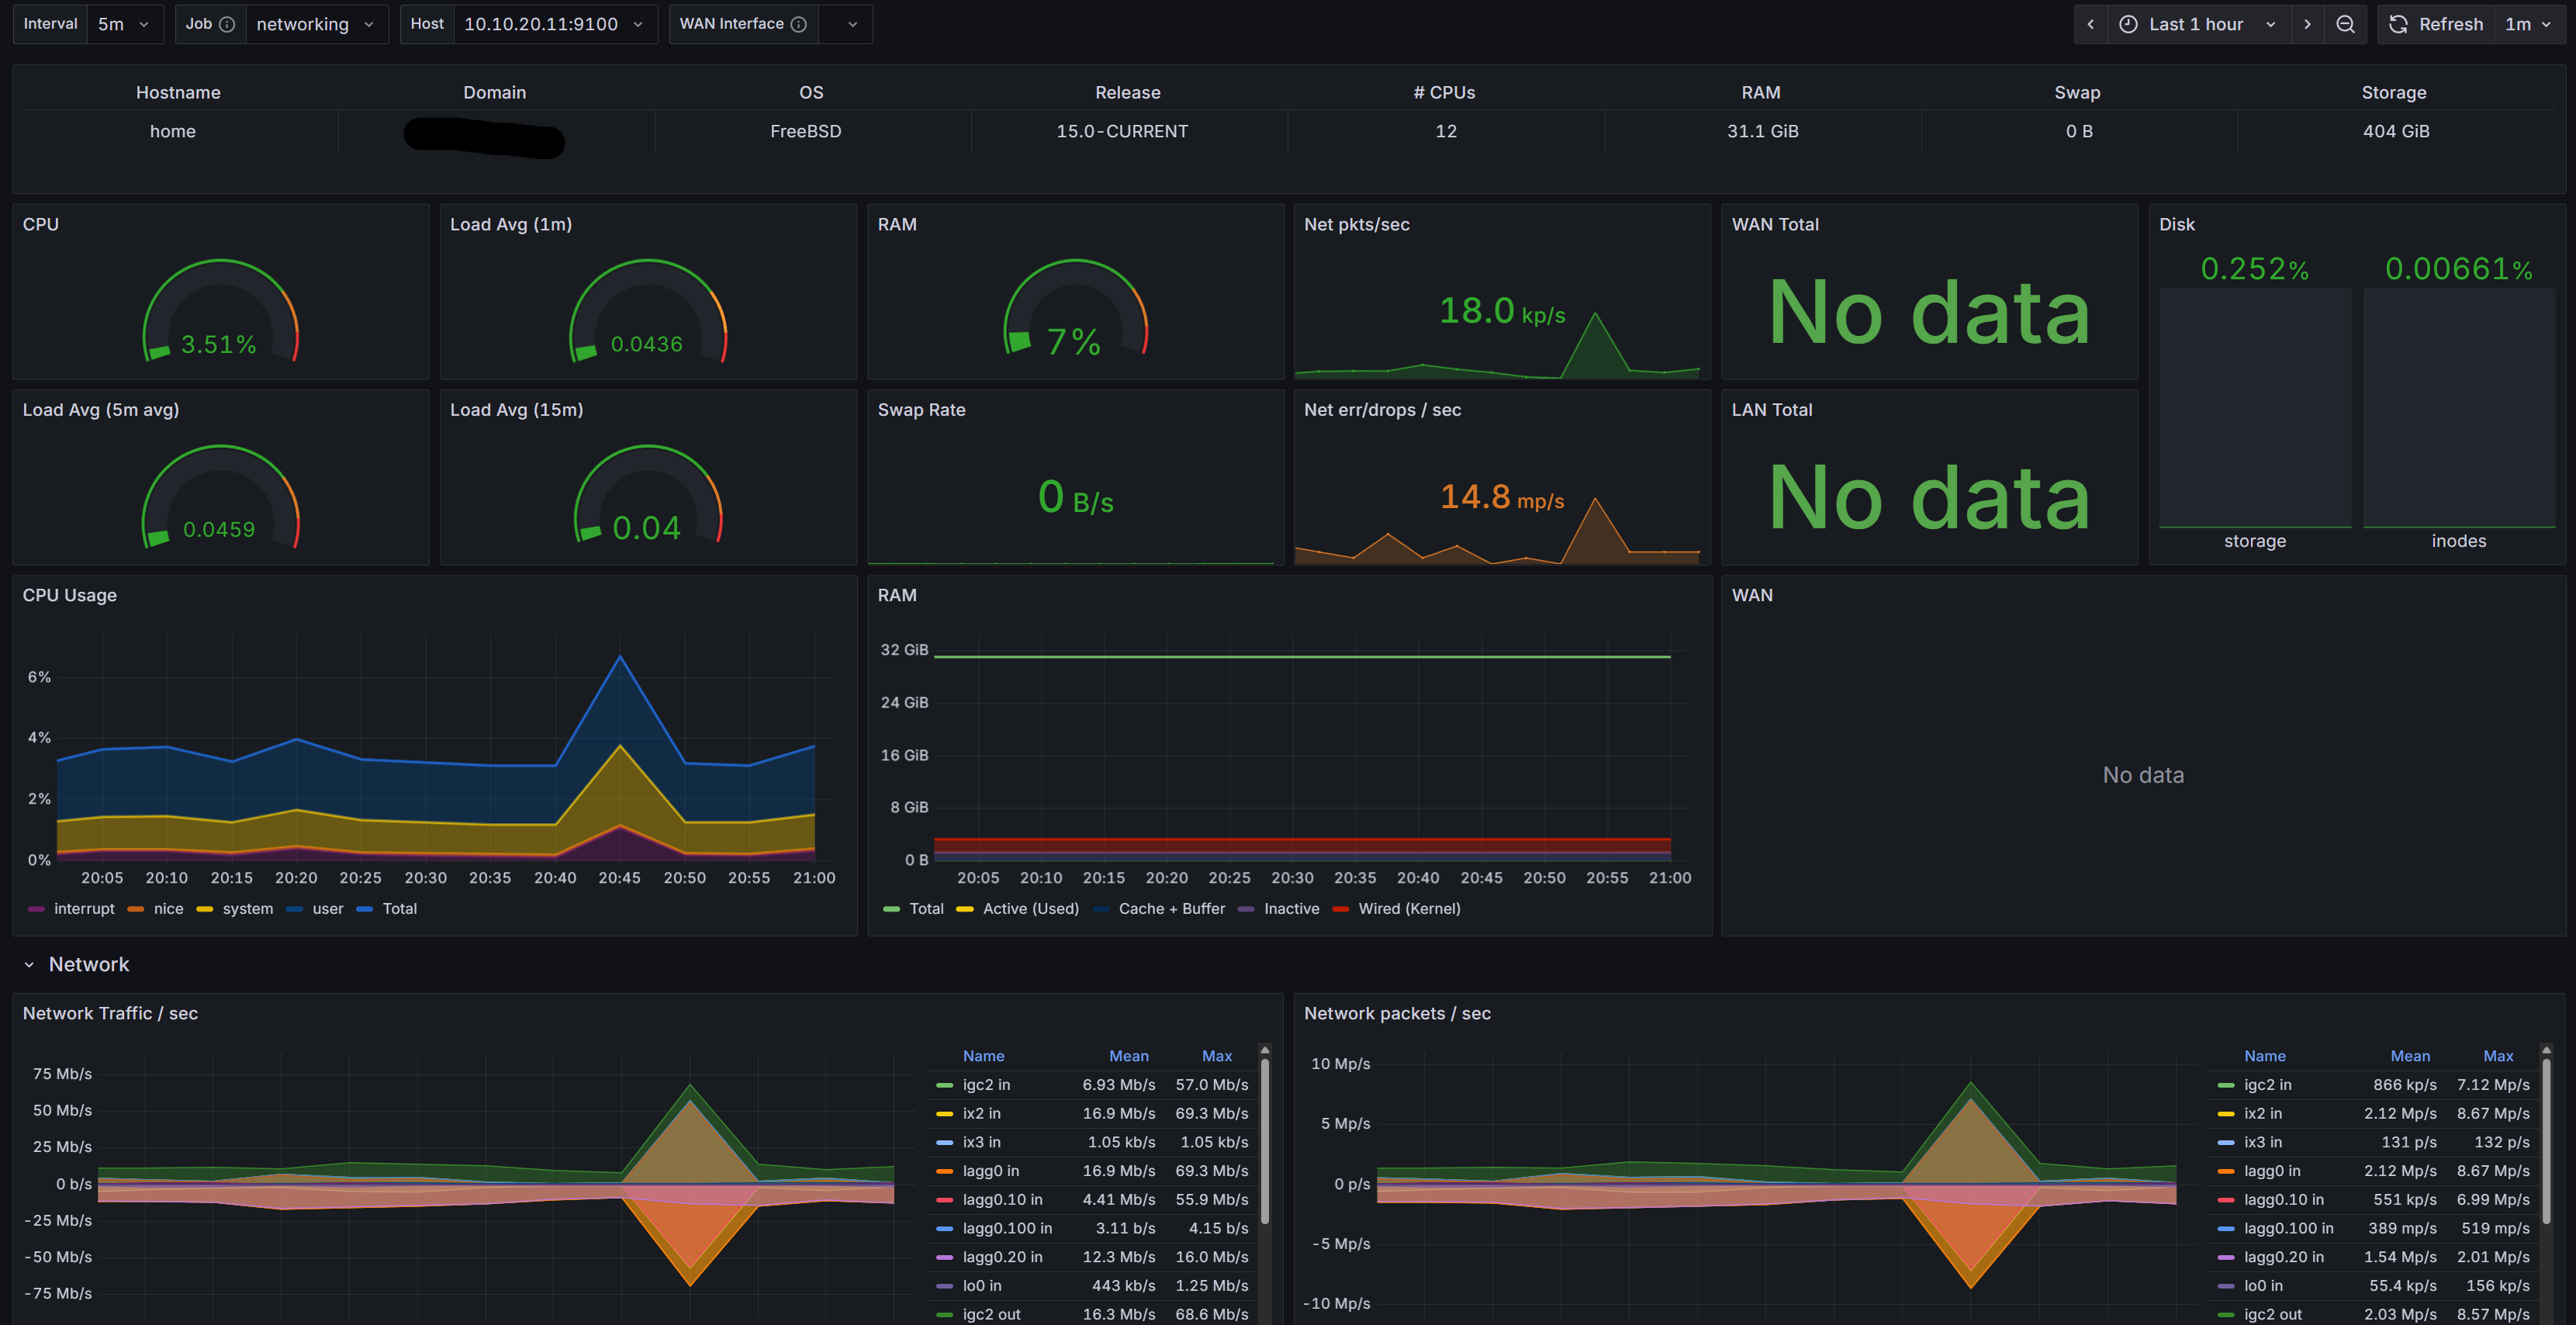
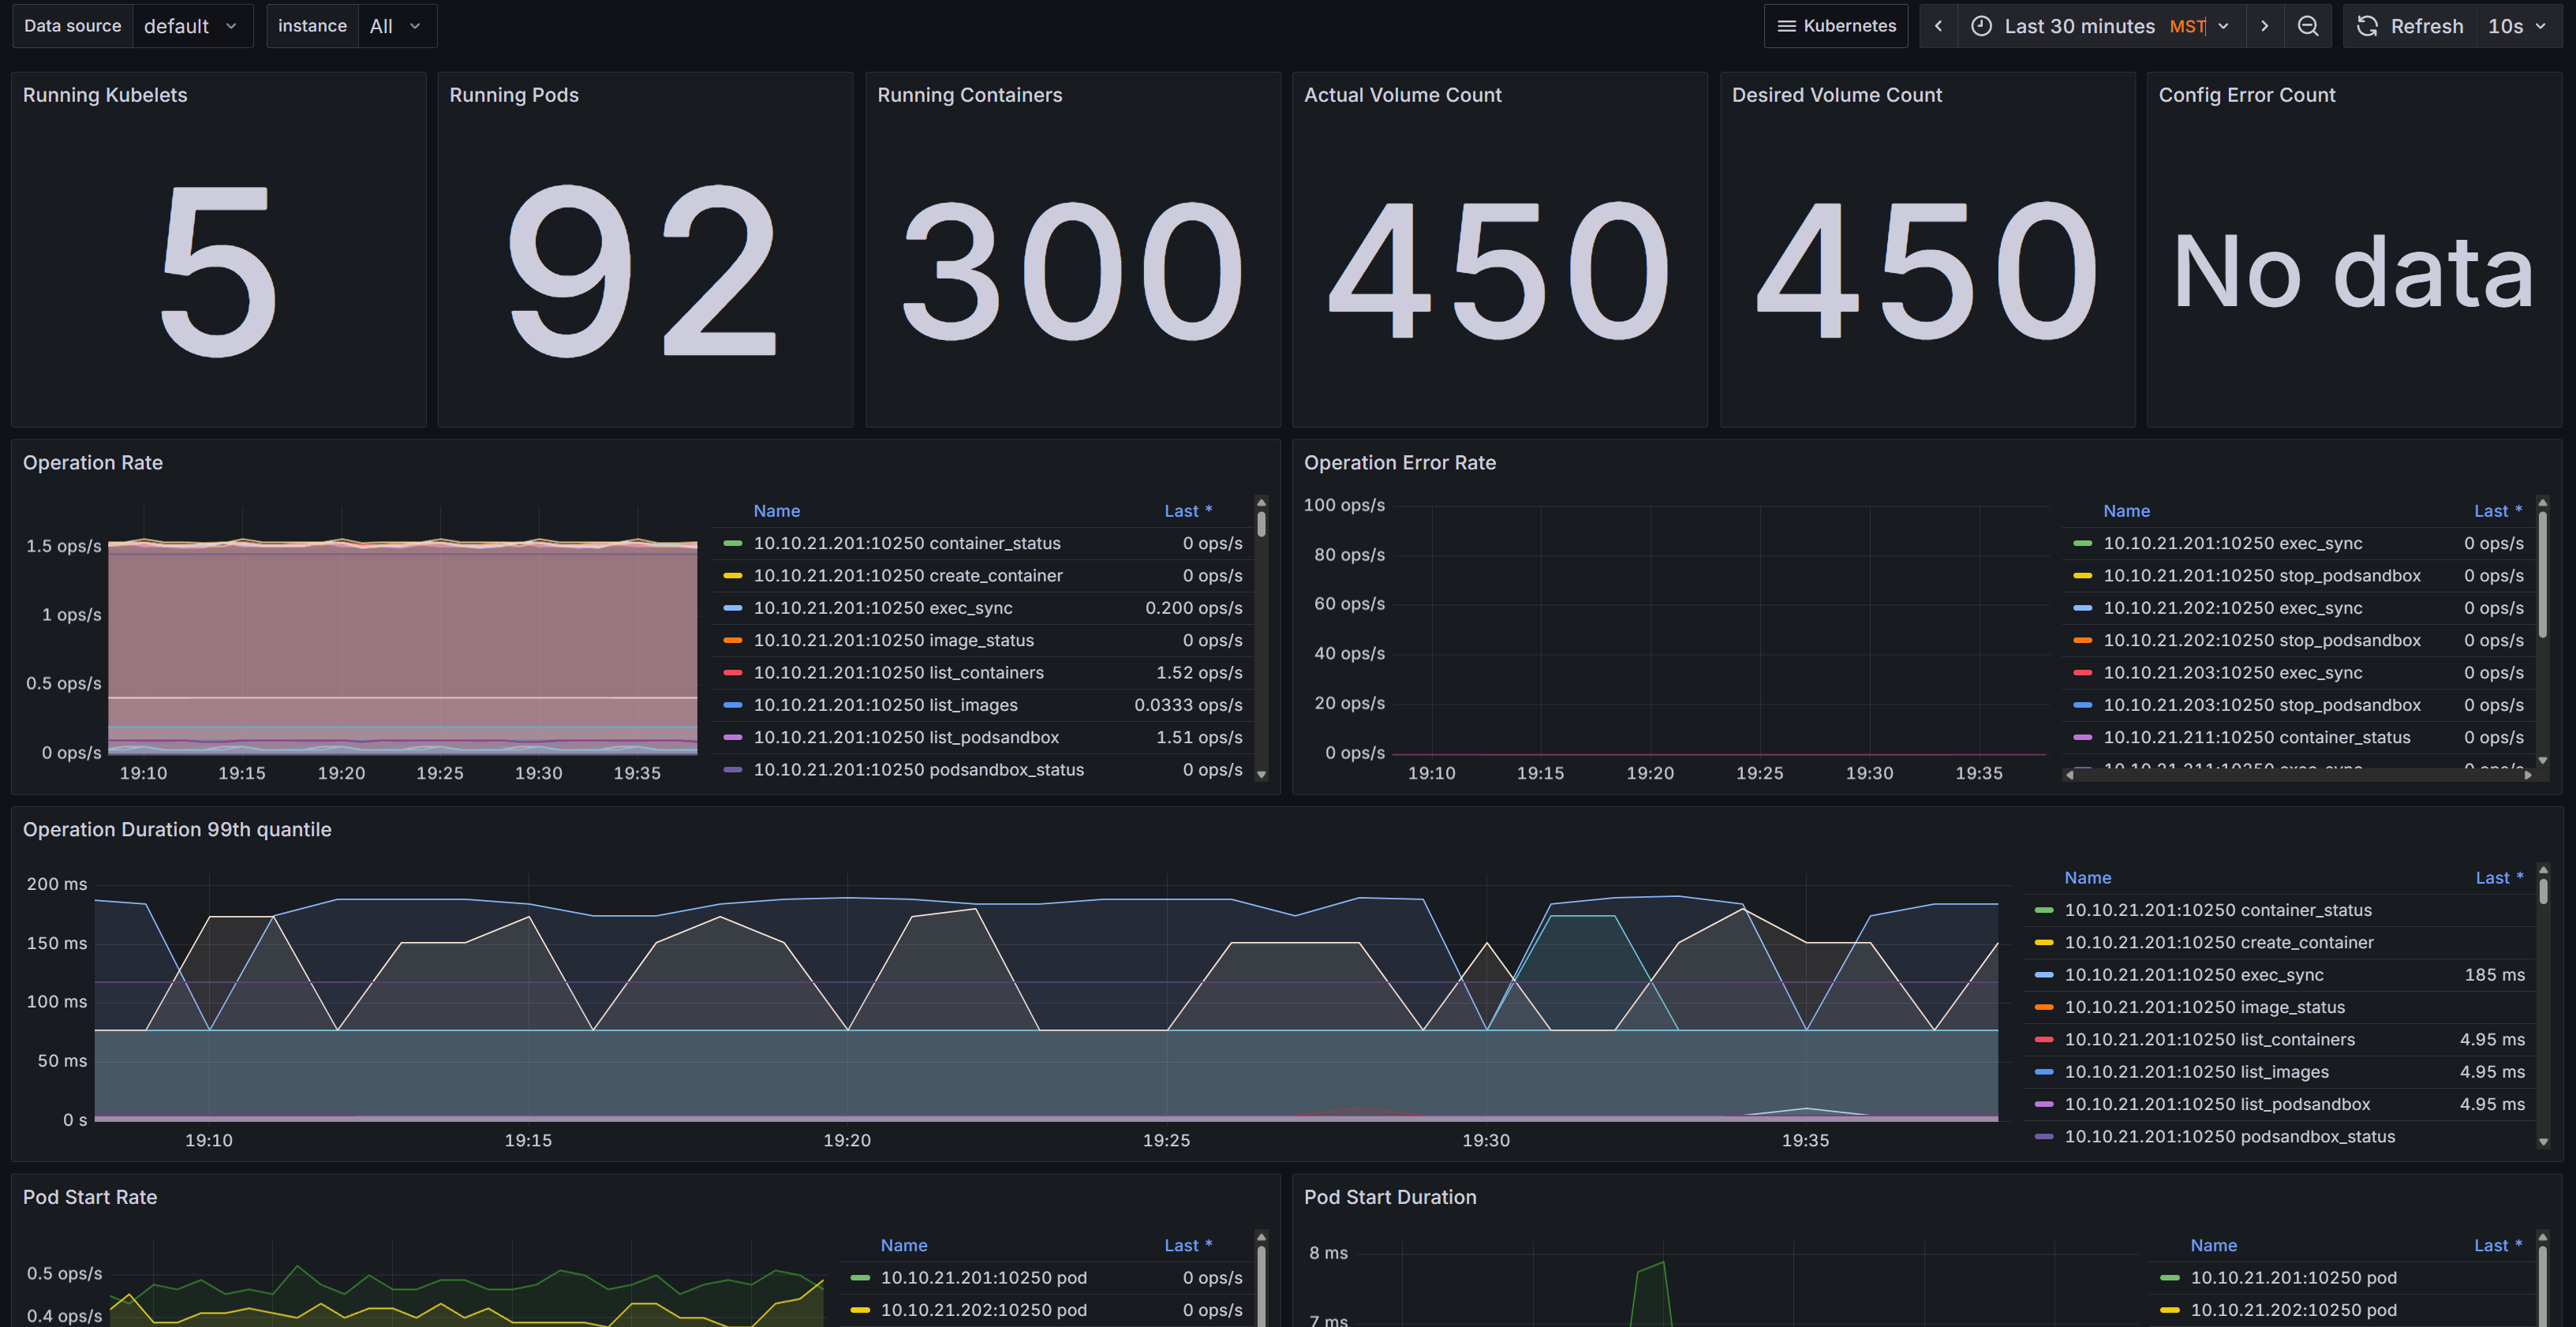
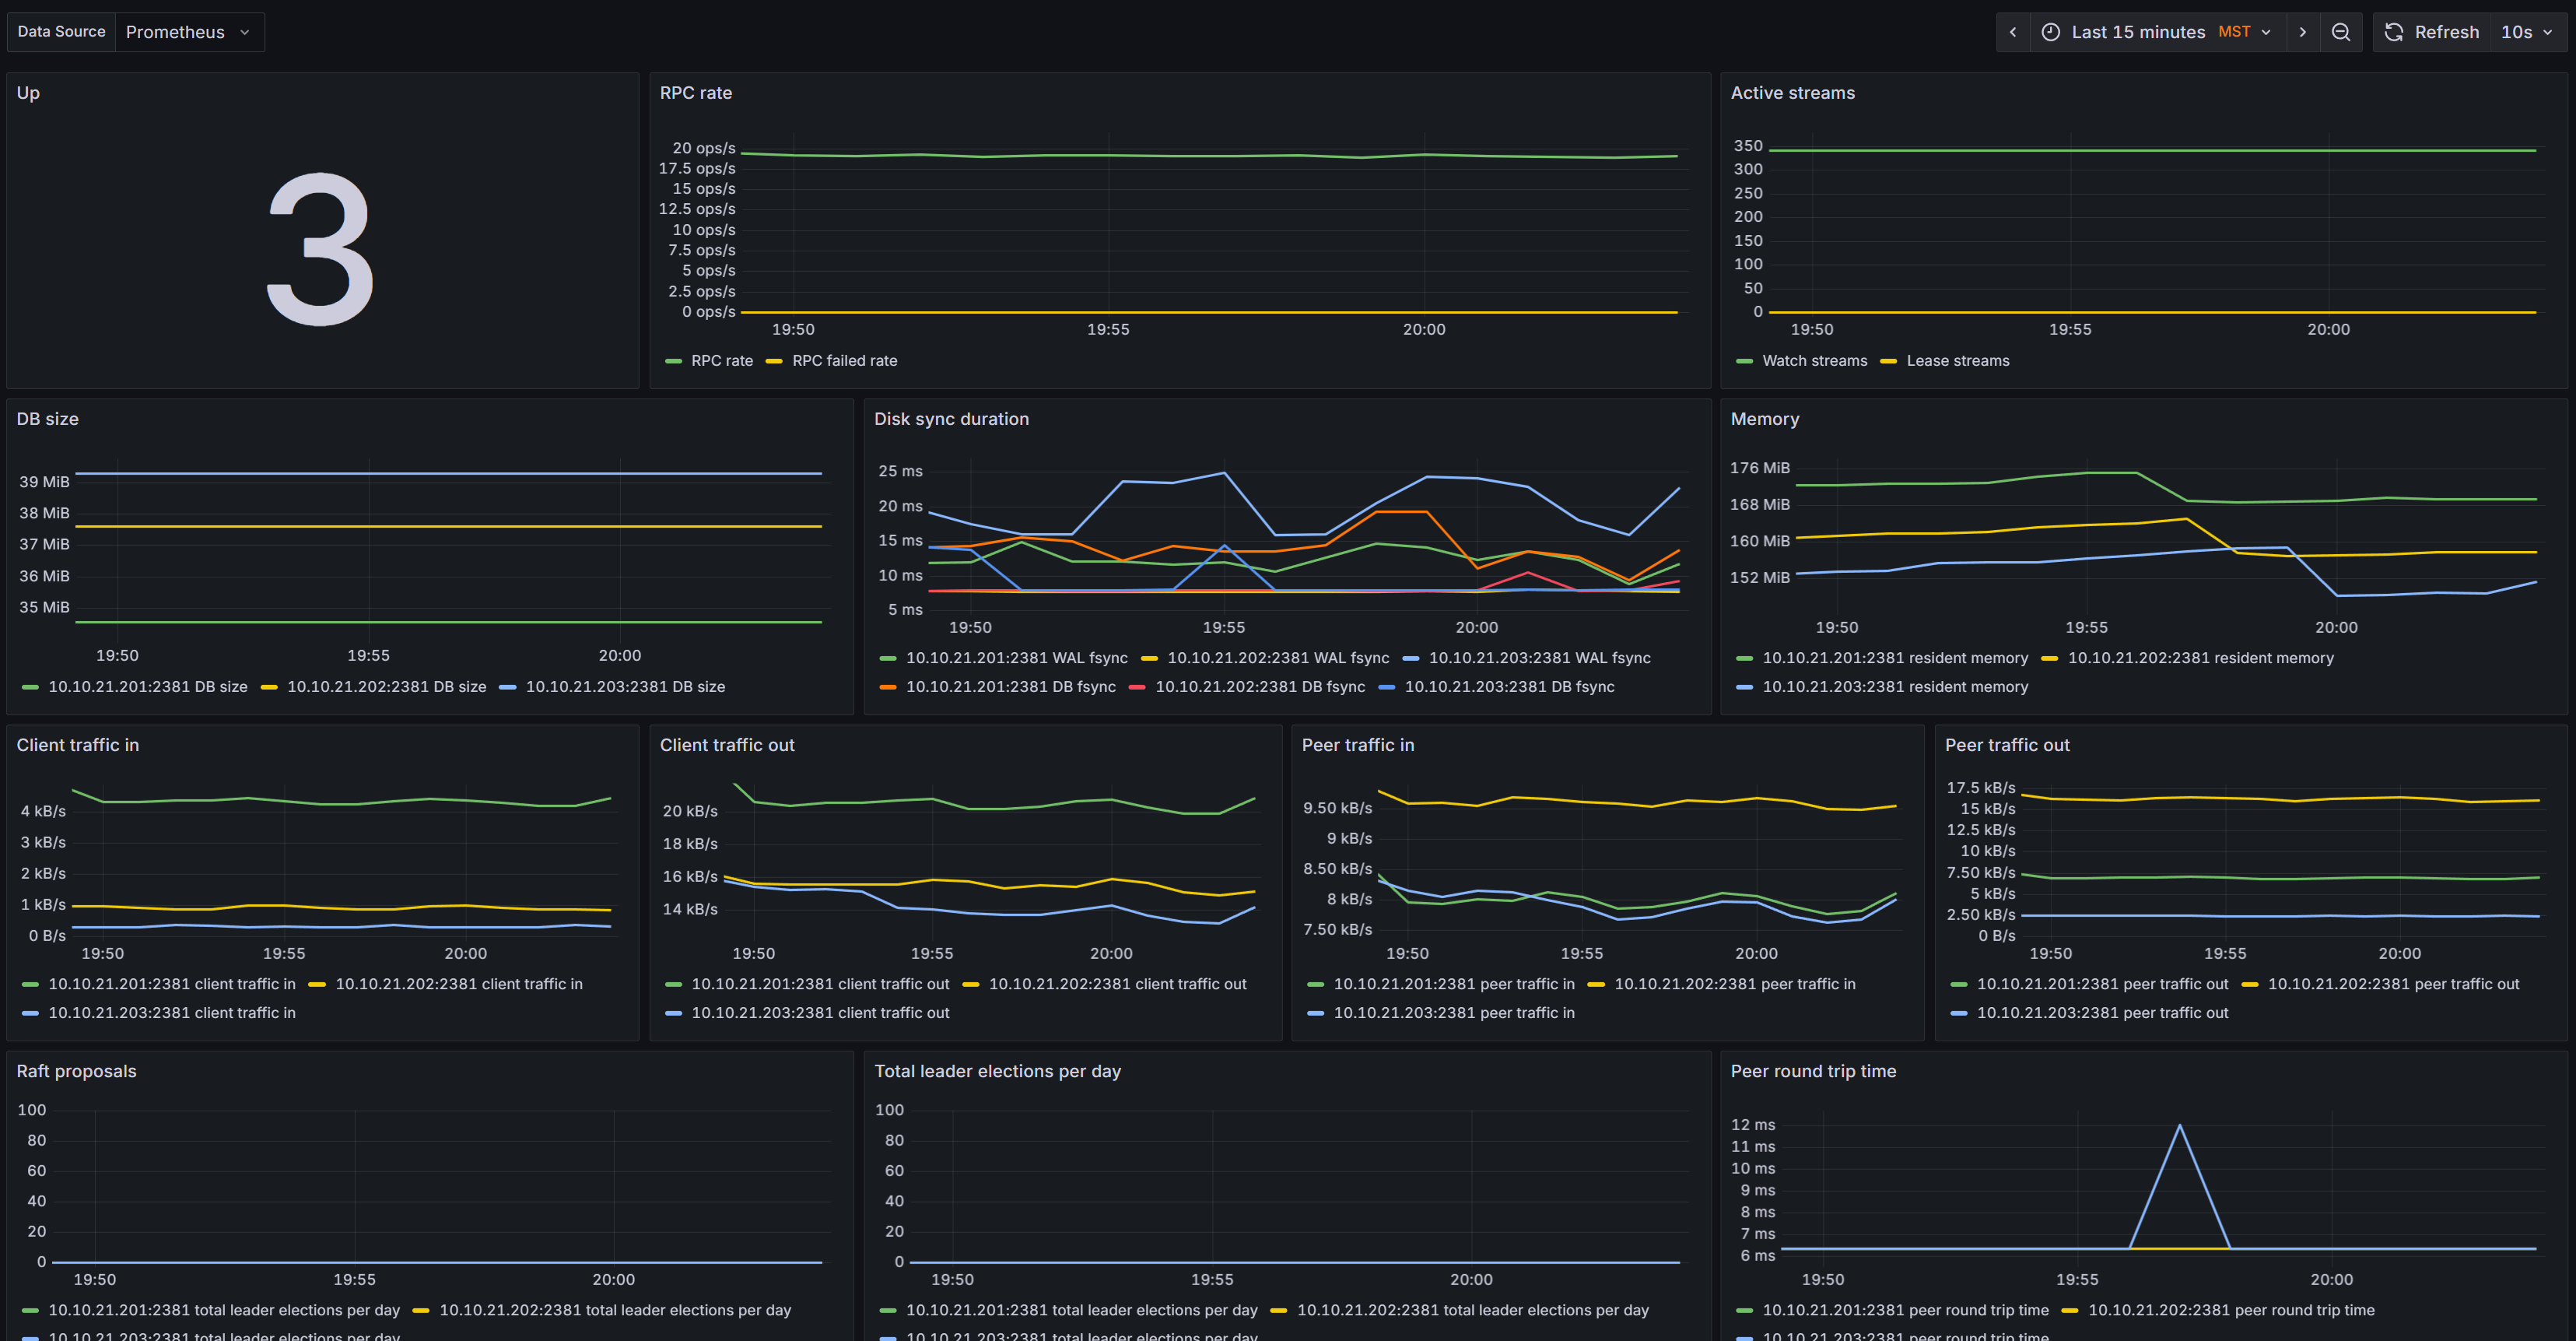
We build monitoring platforms around Prometheus and Grafana that show you exactly what’s happening across servers, applications, and networks in real time. Dashboards are tailored for your audience: executives see high level health, operations teams see infrastructure load and capacity, developers see performance bottlenecks. And when something breaks, the right people get alerted with context, not noise.
A complete observability stack includes:
Metrics you can trust
Every critical component—VMs, databases, Kubernetes clusters, firewalls, storage systems—is instrumented and reported in one place.
Dashboards that tell a story
Not just graphs, but curated views that highlight trends, risks, and the impact on your business.
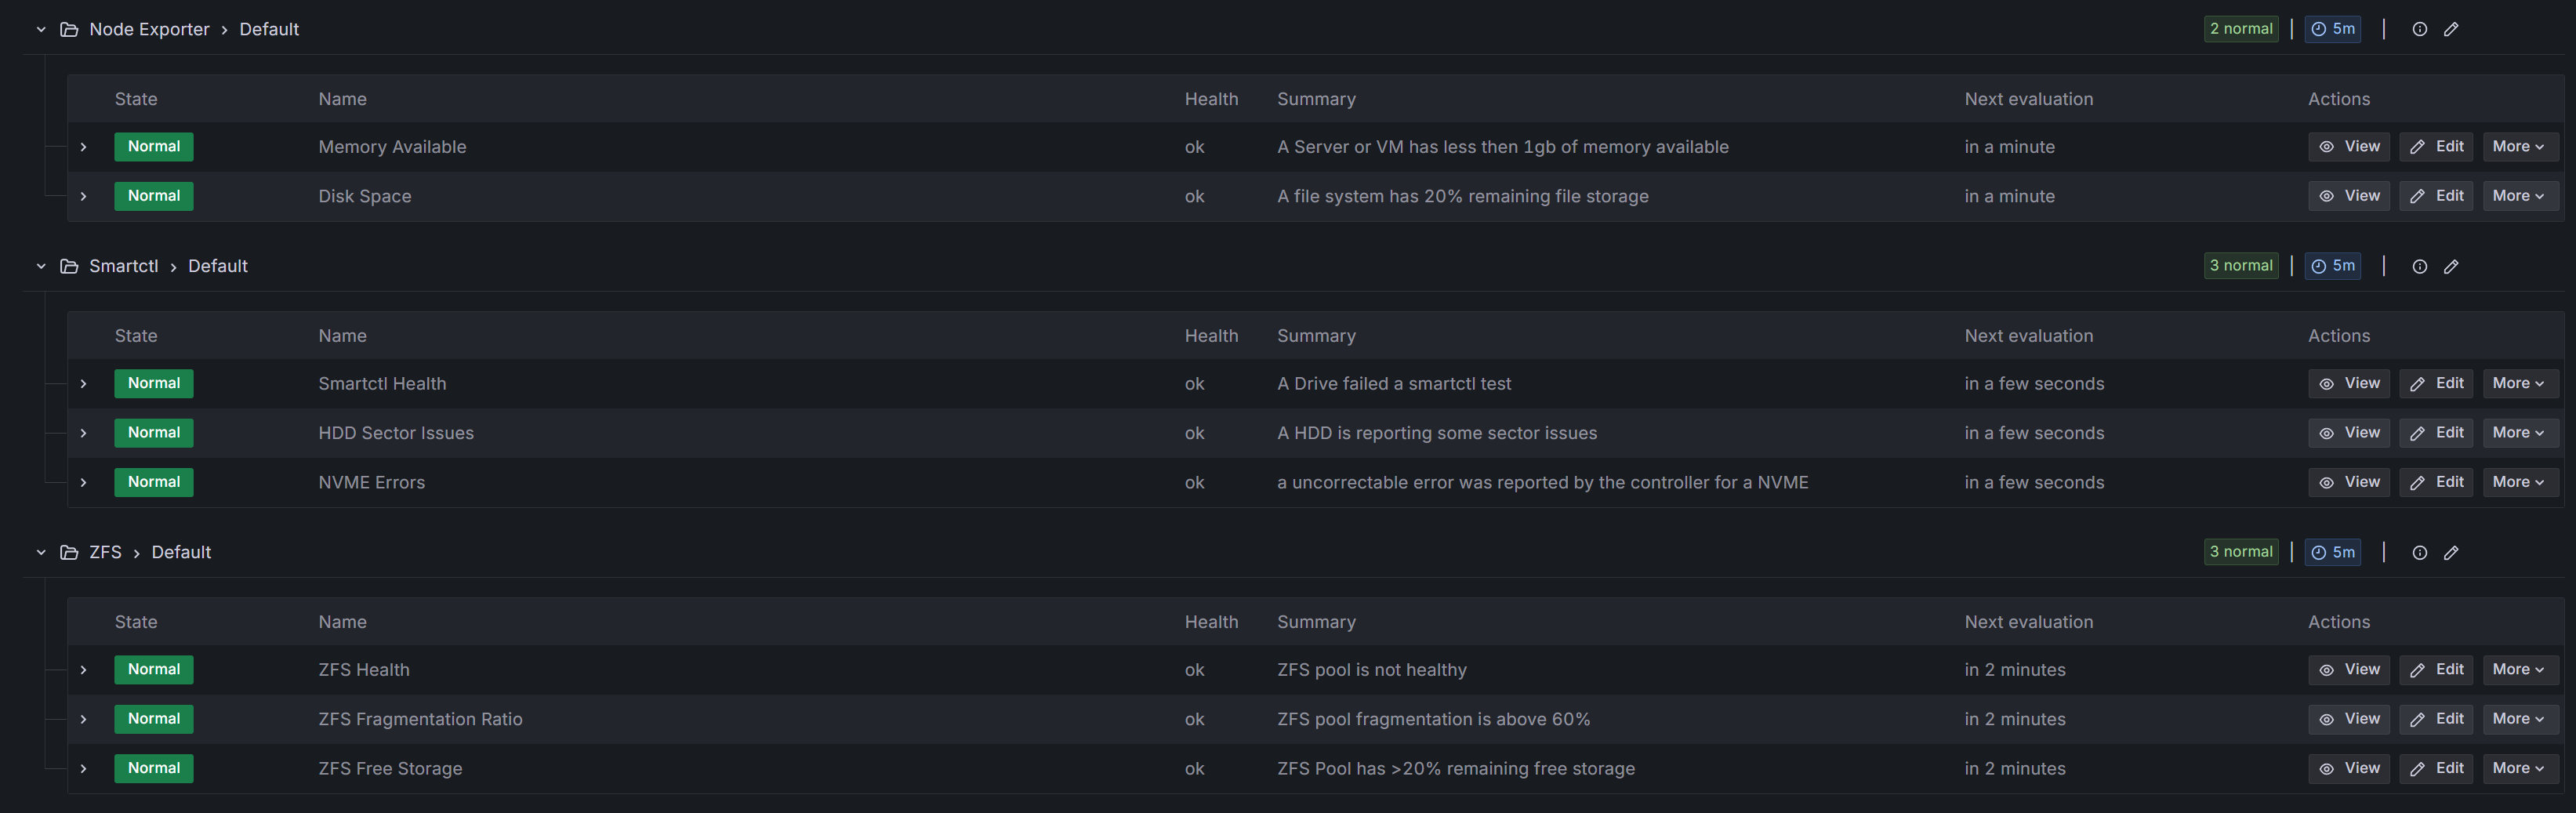
Alerts that matter
Actionable thresholds tied to service level objectives, routed to the right teams via Slack, email, or paging systems.
Logs and traces
Deep visibility with Loki for logs, so you can move from “something broke” to “here’s why” in seconds.
Capacity and cost insight
Forecast resource exhaustion before it happens and track usage patterns to make smarter scaling and spending decisions.
When we deliver a monitoring solution, it’s not just a toolkit—it’s a safety net. You move from guessing and reacting to knowing and planning. Incidents are shorter, scaling is easier, and everyone from developers to decision makers has the clarity they need.